Glowing Lines Cover Bar Chart Illustrating Customs Import and Export Scenario Analysis Report
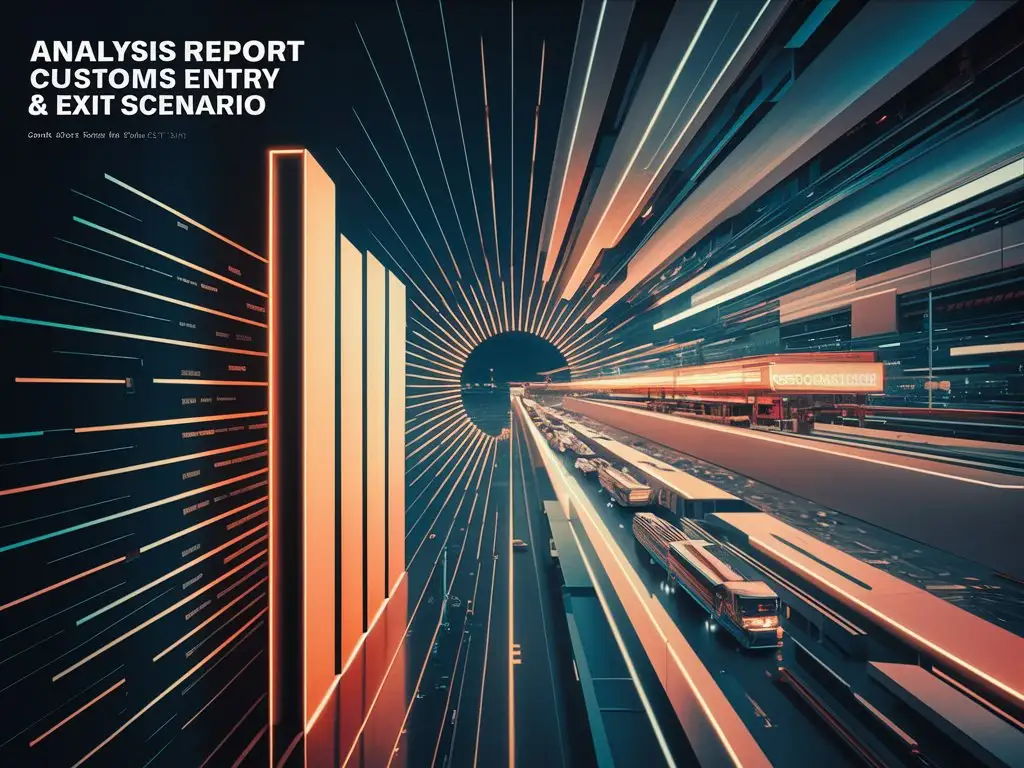
Image Prompt
Prompt
海关进出口场景 分析报告封面 柱状图 发光线条
Choose Model: visiCanvas
Aspect Ratio: 4:3
Generated by Stable Diffusion SDXL
Related AI Images


R

Related Tags
Prompt Analyze
- Subject: The image showcases a bar chart that is adorned with glowing lines, creating an engaging and visually appealing representation of data. This could be utilized for various types of reports or presentations. Setting & Background: A dark background has been used to enhance the visibility and vibrancy of the glowing lines on the bar chart, making it easy to focus on the information being presented while still maintaining an aesthetically pleasing appearance. Style: The style is modern and minimalistic, using a single color for the bars in order to maintain clarity when conveying data. This also helps make the glowing lines stand out more effectively. Coloring: A neon green or blue color has been used for the glowing lines, creating an eye-catching effect that instantly draws attention to the important details of the report. The use of such a bright and bold color contrasts nicely with the dark background while still maintaining professionalism. Action: The action in this image is centered around the bar chart displaying data from customs import and export scenario analysis reports. This type of visual representation helps users quickly understand complex information without needing to delve into raw numbers or text-heavy descriptions. Items & Costumes/Appearance/Accessories: As this is a digital illustration, there are no physical items, costumes, appearances, or accessories involved. However, the focus remains on the bar chart itself, designed in such a way as to clearly communicate essential data while maintaining visual interest.