Urban Data Line Chart Cover Official Government Atmosphere
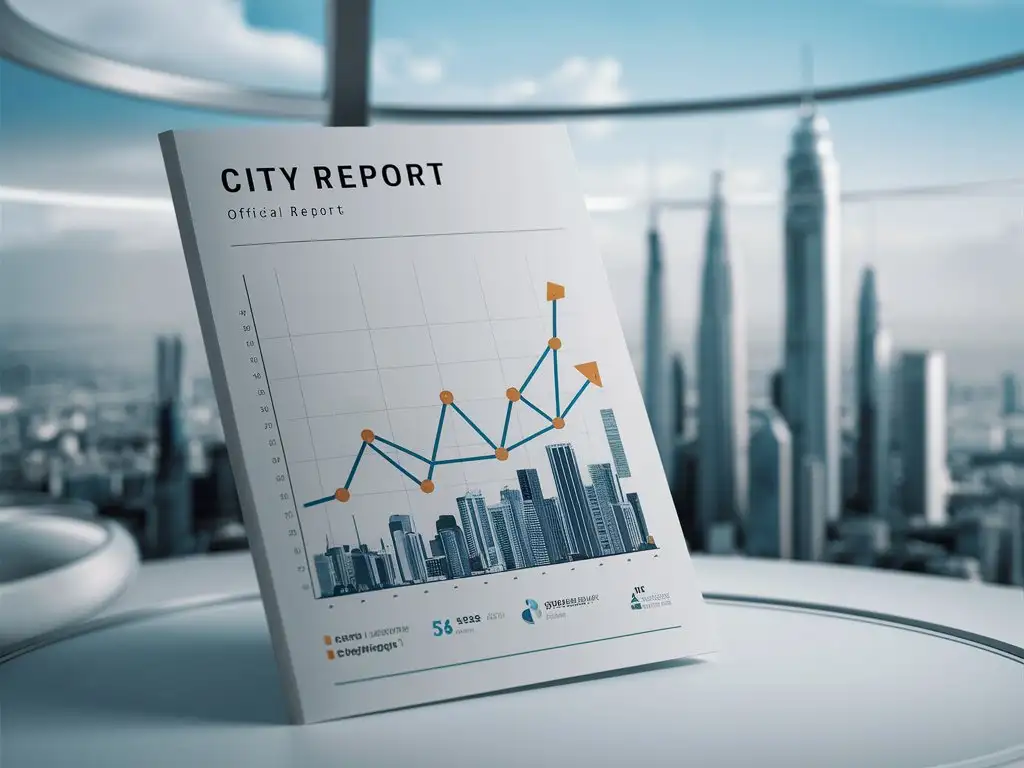
Image Prompt
Prompt
报告封面 平面 城市 数据 折线图 大数据 政务 官方 大气 简洁
Choose Model: visiCanvas
Aspect Ratio: 4:3
Generated by Stable Diffusion SDXL
Related AI Images


Prompt Analyze
- Subject: Report Cover The image is a graphic report cover that focuses on urban data. The main feature of the image is a line chart, which is used to visualize and analyze big data related to urban development, infrastructure, or demographics. Subject: Urban Data The data presented in the line chart should be relevant to urban areas, such as population growth, traffic congestion, or air quality. The data can be presented in a clear and concise manner, making it easy for government officials and other stakeholders to understand and interpret. Subject: Line Chart The line chart is the main visual element of the image. It should be designed in a way that makes it easy to read and understand, with clear labels for the x-axis and y-axis, as well as a legend if necessary. The line chart can be customized to fit the data being presented, such as using different colors or patterns for each line. Subject: Official Government Atmosphere The image should have an official and professional atmosphere, reflecting its purpose as a government report cover. This can be achieved through the use of appropriate colors, typography, and layout. For example, using a muted color palette, clear and legible fonts, and a well-organized layout. Subject: Concise The image should be concise and to the point, focusing on the line chart and urban data. Avoid adding unnecessary elements or distractions that could detract from the main message of the image.