Student Grade Information Management System Diagram
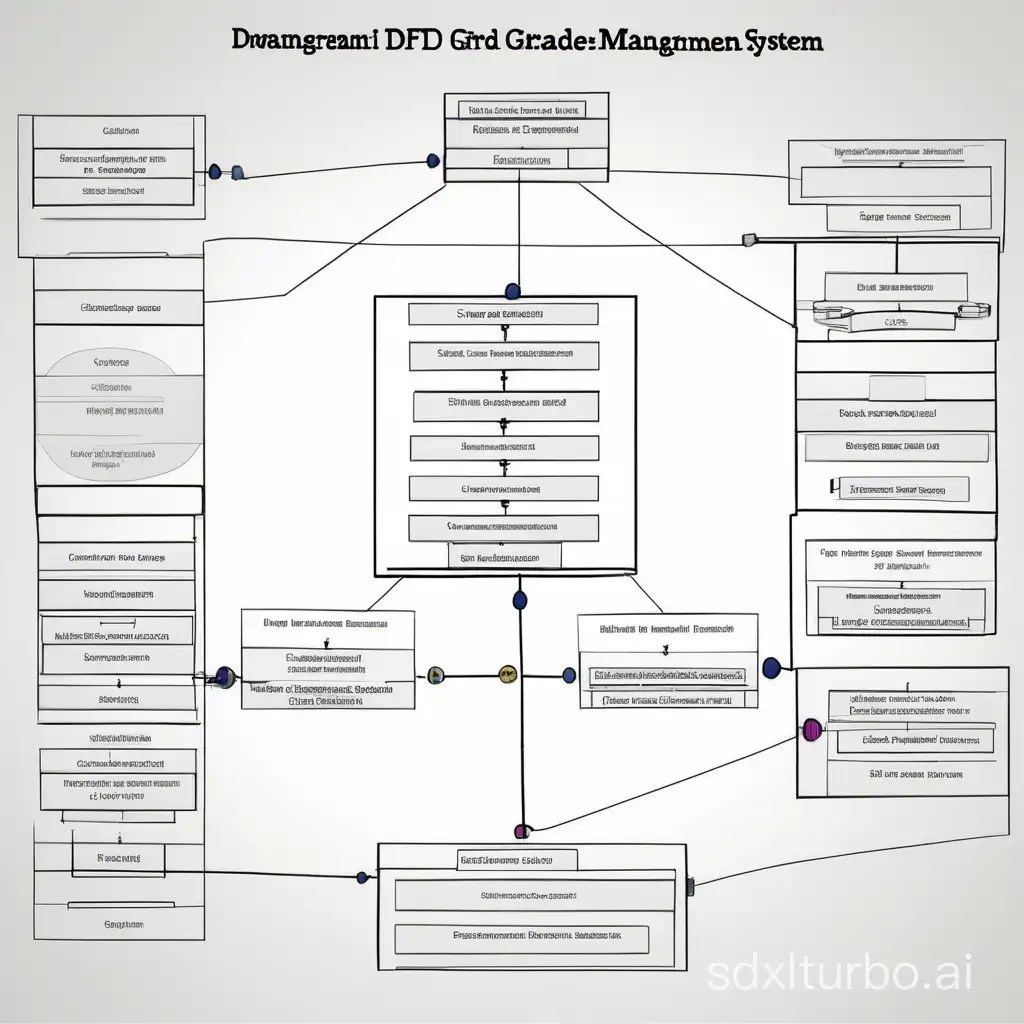
帮我绘制一个关于学生成绩信息管理系统的Contest Diagram DFD 图

Image Prompt

Prompt

帮我绘制一个关于学生成绩信息管理系统的Contest Diagram DFD 图
Choose Model: normal
Aspect Ratio: 1:1
Open in editor
Download
Share To

Generated by Stable Diffusion SDXL

Related AI Images

LOGO design financial management system square cut out English abbreviation FAS, want to cash process management, digital concept
Vector-style diagram of the human digestive system with labeled organs, white background.
R
Information acquisition and knowledge management Answering questions and researching information Aggregating knowledge and creating summaries Processing data from different sources Use only these colors: #B3B5E1, #DBECFF, #F6D7F1, #C2E0F8
Unmanned aerial vehicle reduces system level breakthrough operational barriers, improves intelligence information sharing capability
Please draw a 3D rotation ring device diagram: consisting of three interconnected and roughly equal-sized rotatable rings, capable of three-axis rotation, including a 3D rotation motion system and an operation control system. The 3D rotation movement system software consists of four modules: roller system motion information instrument display, motion information setting, motion control operation, and timing setting display. A laboratory mouse is securely placed in the inner ring bracket of the dark box. At the same time, the extended music module plays music during rotation. The driving motor controls the rotational angular velocity, acceleration, and position of the outer ring, middle ring, and inner ring; it can display animal motion status and acceleration information in real-time; and it can accurately set training duration and posture. The rotation range of the outer ring, middle ring, and inner ring is 360° for continuous rotation. The net load of the wheel is 0-3 kg, speed 0-30 rpm, and training time can be set. The movement control mode includes three-axis reset, wheel brake, start training, and end training.
Warehouse control room with large monitors displaying real-time data from a smart warehouse management system.  Graphs and charts visualize energy consumption, waste generation, and operational efficiency.  Data analysis is being used to optimize warehouse sustainability.
I want to create a school logo with the following information: the outside circle writes 镇江市中山路小学 (Zhenjiang Changshanlu Primary School, Zhenjiang City), and the center is a large number 6 with the words 2024级6班 (Grade 6, Class 6) below it.
future city planning diagram

Prompt Analyze

  • Subject: The diagram should represent a comprehensive system for managing student grade information, incorporating various actors such as students, teachers, administrators, and possibly parents. Each actor's role and interaction with the system should be clearly defined. Setting/Background: The system operates within an educational institution, be it a school, college, or university. The background should reflect an academic environment, with elements like books, a chalkboard, or a computer screen displaying the system's interface. Style/Coloring: The diagram should be professional and easy to understand, using a color scheme that is typically associated with educational institutions, such as blue, green, or gray. The style should be modern yet clean, with clear lines and icons to represent different components of the system. Action/Items: The flow of data within the system is crucial. Show the process of inputting grades by teachers, the retrieval of this information by students and parents, and the administrative oversight and data analysis that takes place. Include icons for actions like 'enter grade', 'view grade', 'generate report', and 'update records'. Costume/Appearance/Accessories: Characters in the diagram, such as students and teachers, should be represented in a professional or academic setting. Students might be shown in casual attire or uniforms, while teachers could be depicted in professional attire. Accessories like laptops, ID badges, or textbooks can be included to enhance the academic theme. The final diagram should be a clear and detailed representation of how the student grade information management system operates, highlighting the key components and interactions that make it function effectively.