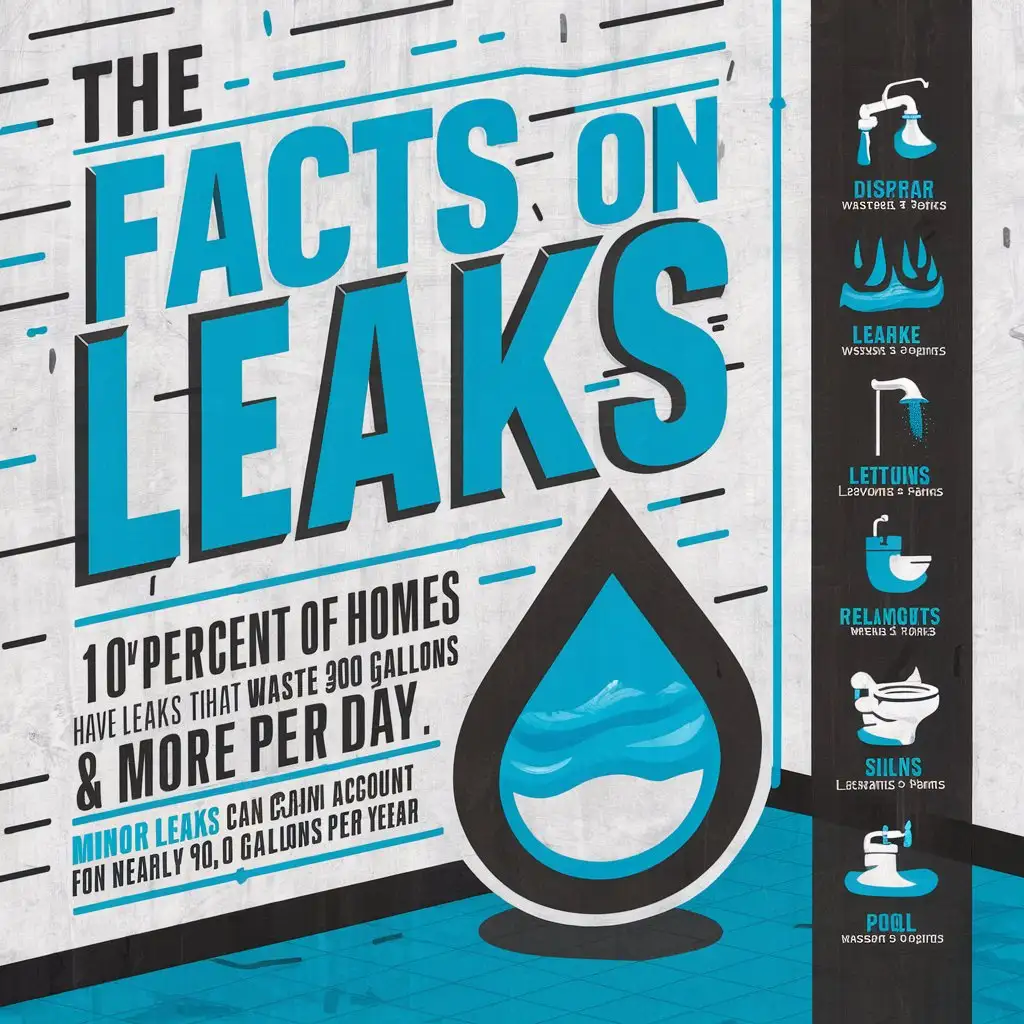
Visualizing Water Leaks The Facts and Impacts

I need an infographics based on the information given below. Make sure that the color scheme, background image and graphics aligns with the main idea of the text. The infographic is designed to convey information about water leaks in a visually engaging manner. It uses a color scheme of blue, white, and black, which is commonly associated with water and cleanliness. The title "THE FACTS ON LEAKS" is prominently displayed at the top in bold blue letters against a white background.  The first section of the infographic, highlighted by a large blue drop icon, states that "10 percent of homes have leaks that waste 90 gallons or more per day." This statistic is followed by a smaller text explaining that minor leaks can account for nearly 3,000 gallons per year.  To the right, there's a sidebar with icons representing different types of leaks and their impact. These include a faucet dripping, a shower leaking, a toilet running, a sink leaking, and a pool leaking. Each icon is accompanied by a fact: a leaky faucet dripping at the rate of one drip per second can waste more than 10 gallons; a shower leaking at a rate of 10 drips per minute wastes 500 gallons per hour; an old toilet can waste up to 11 million gallons over its lifetime; a leaking pool can waste up to 13,000 gallons of water annually.  Below these facts, there are three call-to-action sections: "Did you know?" encourages engagement with the content; "Homeowners" suggests actions like replacing old toilets and repairing leaks; "Look for" lists signs of leaks such as wet spots on lawns and water damage.  At the bottom of the infographic, there is a footer with logos and links to additional resources. The logo includes the text "WaterSense" and a tagline "Making water efficiency easy." There is also a link provided to the EPA (Environmental Protection Agency) website, indicating that this infographic is likely sponsored or created in collaboration with this organization.
R

Image Prompt

Prompt

I need an infographics based on the information given below. Make sure that the color scheme, background image and graphics aligns with the main idea of the text. The infographic is designed to convey information about water leaks in a visually engaging manner. It uses a color scheme of blue, white, and black, which is commonly associated with water and cleanliness. The title "THE FACTS ON LEAKS" is prominently displayed at the top in bold blue letters against a white background. The first section of the infographic, highlighted by a large blue drop icon, states that "10 percent of homes have leaks that waste 90 gallons or more per day." This statistic is followed by a smaller text explaining that minor leaks can account for nearly 3,000 gallons per year. To the right, there's a sidebar with icons representing different types of leaks and their impact. These include a faucet dripping, a shower leaking, a toilet running, a sink leaking, and a pool leaking. Each icon is accompanied by a fact: a leaky faucet dripping at the rate of one drip per second can waste more than 10 gallons; a shower leaking at a rate of 10 drips per minute wastes 500 gallons per hour; an old toilet can waste up to 11 million gallons over its lifetime; a leaking pool can waste up to 13,000 gallons of water annually. Below these facts, there are three call-to-action sections: "Did you know?" encourages engagement with the content; "Homeowners" suggests actions like replacing old toilets and repairing leaks; "Look for" lists signs of leaks such as wet spots on lawns and water damage. At the bottom of the infographic, there is a footer with logos and links to additional resources. The logo includes the text "WaterSense" and a tagline "Making water efficiency easy." There is also a link provided to the EPA (Environmental Protection Agency) website, indicating that this infographic is likely sponsored or created in collaboration with this organization.
Choose Model: visiCanvas
Aspect Ratio: 1:1
Open in editor
Download
Share To

Generated by Stable Diffusion SDXL

Related AI Images

Cartoon boys and girls playing in the water park, having a water fight together with water guns and beach balls.
R
a glass of water with a flame inside. the flame is reacting with the water. the flame come from the bottom and make bubbles and some smoke
Rise above the water Surface reflection emerged from the water surface
image of a white background and crossing the entire image a turbulent stream of water with much detail. The white background and a small stream should be mainly visible as if falling from a glass. The effect should be like that of an advertisement in which water and water droplets are the main focus
The setting clouds and the solitary owl fly together, the autumn water and the sky become one color
A skincare product falls into the water, splashing water, with half of the skincare product submerged in the water. Side view, transparent glass packaging, overall color tending towards blue.
a photorealistic, detailed, bokeh, mist, inspiring, tranquil, symmetric, Tibetan temple backyard, Buddha statue, meditation space lush with green vegetation and water flowing in the middle, blooming lotus on the water, warm and inviting, the image is symmetric

Prompt Analyze

  • Subject: The main subject of the infographic is water leaks, depicted through various graphics and statistics. Setting: The background color scheme and imagery align with the theme of water and cleanliness, using shades of blue, white, and black. Style/Coloring: The style of the infographic is visually engaging, with bold blue letters for the title and prominent use of blue drops to highlight key statistics. Action: The infographic conveys information about the impact of water leaks, including statistics on wasted gallons per day and per year. Items: Different types of leaks are represented by icons, including faucets, showers, toilets, sinks, and pools, each accompanied by relevant facts. Costume or Appearance: The appearance of the infographic is professional and informative, with clear text and visually appealing graphics. Accessories: The footer includes logos and links to additional resources, indicating potential sponsorship or collaboration with organizations like the EPA.